

How can we help?Get in touch
The end of the month is approaching and between most of the tools of tasks management of the community, managers appears a task that is done to us uphill: the report of statistics of the social networks. Yes, friends, data collection days begin. You will have seen a million articles on the subject and just as each person has a personality, each community produces a type of report. As you will see during the development of the post it can be done in many ways depending on the objectives you set for each client. But what is certain, is that you will have to do them. Are you up to it? Let's get started.
Why is it necessary to deliver reports to your clients?
There are several reasons why providing weekly, monthly or daily statistical reports will save your life. Mainly to demonstrate to your clients that you are working and that your work is getting its fruits and the second great reason seems to me fundamental, and it is to anticipate, correct and improve continuously. Every time a metric is altered it allows you to focus on it and improve it, always following the objectives but altering the strategies and correcting them. You end up knowing your audience more than yourself and that gives you a great advantage and security.
Defining the objectives
It is essential to start with this step, establish some objectives to know the metrics you are going to use.
In the case of wanting to generate community, increase the followers of social networks, you must measure these data from the moment you take the customer accounts and observe the evolution each month.
If you want to focus on engagement you must obtain the metrics related to user interactions, in other words, likes, comments and shared in all your publications.
In the case of branding, what you want to achieve is to be continued in the top of mind of our audience so you must focus all our energy on the publications of all social media you use.
In order to increase traffic to your client's website, you must increase the number of links to your client's website and thus increase the number of visits. For example, in an online store is essential, because you want to increase the chances of a purchase.
Frequency
The frequency with which you are going to make the report depends basically on the client type. It is clear that the more frequent the better, but I recommend that for small customers you do it once a month and for large customers once a week.
The ideal period to do a statistics report is monthly, accompanied by a more general quarterly and another at the end of the year.
This type of reports are general but you can also do them at the end of a campaign, to analyze the data in depth and thus know the ROI (return on investment).
Tools
There are infinite tools that allow you to obtain numerous metrics. If you are new, you can start by checking the metrics for free on Facebook Insights, Twitter Analytics, Youtube Analytics, Google Analytics, even Instagram also offers you very interesting data for free. These tools are very easy to use. Facebook allows you to export a personalized excel where you can incorporate the KPI´s that interest you, taking away a lot of data that you are not going to use.
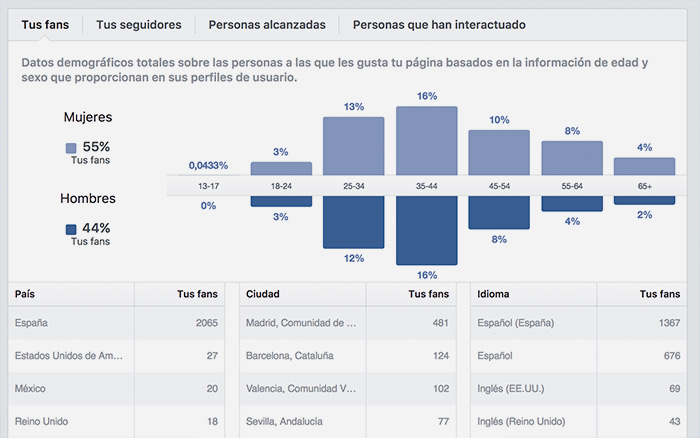
Facebook's KPI
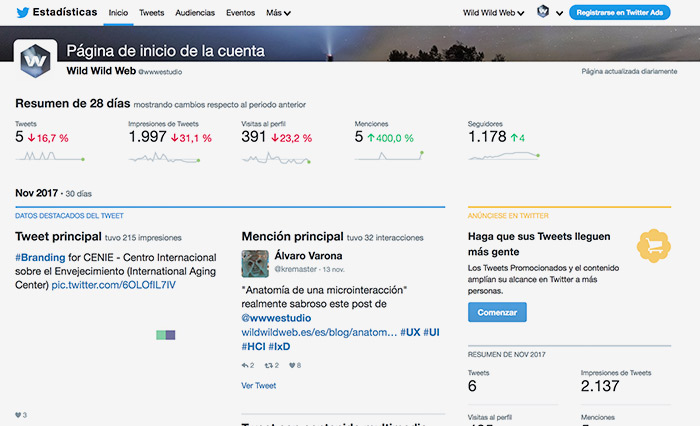
Twitter's KPI
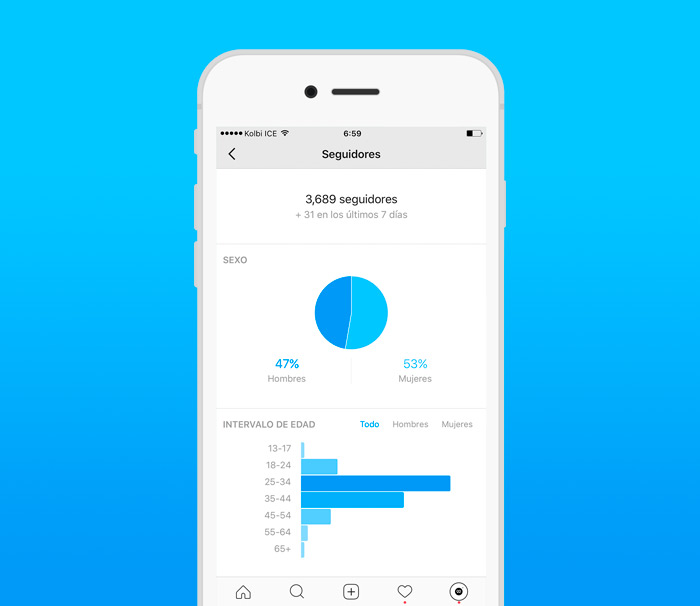
Instagram's KPI
If you need something more insightful, there are many paid tools that allow you to monitor, manage and analyze various profiles of social networks in a very comfortable way. Among the most popular are Hootsuite, Sprout Social or Onlypult. They allow to see from the same screen the publications made and the interactions of the audience in real time, to schedule content and to elaborate complex reports. Choose the one you like best and that fits your budget.
What metrics or KPI´s (Key Performance Indicators) should I follow and analyze?
Qualitative measurement will help us observe and analyze how our audience is responding.
Measures such as influence (who is talking about our brand), reputation (what is being said about our brand) or participation (active communication of the audience and brand) will help us concretize the qualitative measurement, but this is material for another post.
The quantitative measurement (on which we are going to focus in this article) will allow us to objectively know the results until the moment that our strategy is having. And track our client's return on investment.
There are an infinite number of metrics, but I propose the following, although you can always eliminate or incorporate those that interest you. Don't forget to make a thorough analysis of your competitors, using the same data that you incorporate to your brand report and add all the results to your document. It will help you keep up to date with what's new.
Likes
New followers
Total reach: Viral reach, Organic reach, Paid each
Total reach of publications: Viral reach, Organic reach, Paid Reach
Reactions of the publications
Likes in publications
Comments in publications
Shared in publications
Click on the publications
Speaking
People who interact according to age and sex
Fans according to age and sex
Twitter
Followers
Following
Tweets
New followers
Retweets
Likes
Clicks
Impressions
Interaction rate
Instagram
Followers
Following
No of publications
Impressions
Reach
Views
Interactions
Youtube
Subscribers
Views
Reproductions
Best Video Views
Pinterest
(Pinterest has the Pinterest Analytics that gives you an infinity of metrics of your profile, people you interact with and your website)
Followers
Followings
Boards
Pines
Linkedin
Followers
Recommendations
Comments
Impressions
Web
Sessions
Users
Templates
Once you have chosen the metrics that you are going to analyze according to the chosen Social Media strategy, the idea is to make the templates that you are going to use to speed up the process.
Normally we deliver an excel with the evolution of the data and a PowerPoint which includes the most significant data, graphs, competitor's metrics and conclusions that includes an analysis of the contents that have had the best and worst results. This last section is very interesting, it allows you to know which topics interest your audience most and in which formats. Many times you are forced to share a type of content that your followers are not interested in but you can present it in the most attractive way and turn the circumstance around.
Conclusions
As you can see there are countless options to make statistical reports for your clients, each one can be different depending on the strategy you follow. Elaborate your own templates and PowerPoint, as well as a protocol to follow it, will help you not to overlook anything and that any person of the company can make them in your absence. What is really important and complicated is what comes next: a thorough analysis of the results obtained. The answer to the big question: Are we on the right track?
Main photography: Simone Hutsch
Author
Related works

The digital transformation of one of the most prestigious and influential brands.
Designing the brand and the digital ecosystem of the leading website for coworking spaces in Spain.