


How can we help?Get in touch
Pinterest has an analysis tool with a very intuitive and simple interface. Anyone who has a bussines account can use it.
Pinterest Analytics allows you to track the activity of your profile, the activity of your audience and the traffic to your website. Something very interesting to optimize your marketing strategy.
When you enter the Analytics section you will find a drop-down menu with several options:
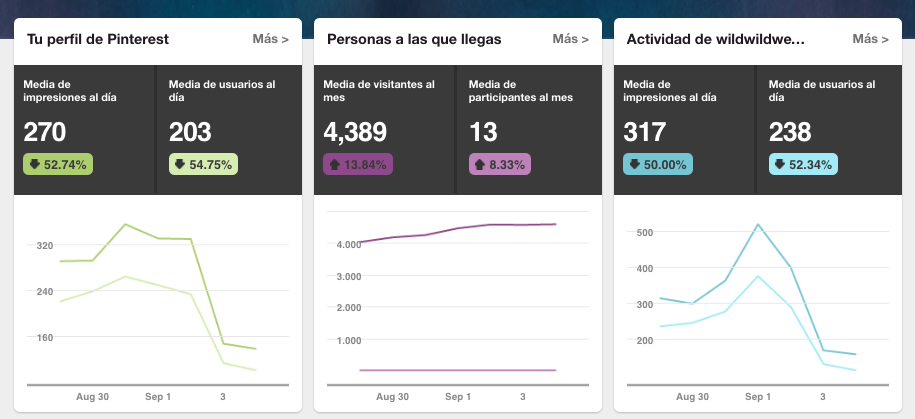
- General information, shows us an overview of all metrics.
- Your Pinterest Profile, analyze your company account.
- People you reach, analytical data about your audience.
- Website. You will find all the information related to your page. In order to access it you must have verified it.
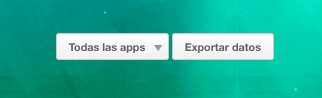
Within the statistics you can filter through "All apps" dropdown depending on the device and operating system used, in order to obtain more precise information on the behavior of users when they use each of them.
In addition, you have the possibility of selecting the determined period of time that most interests you and also to export the data.
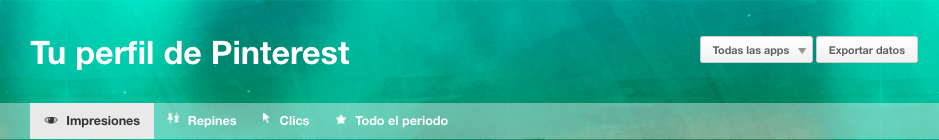
1.Profile: how our account works.
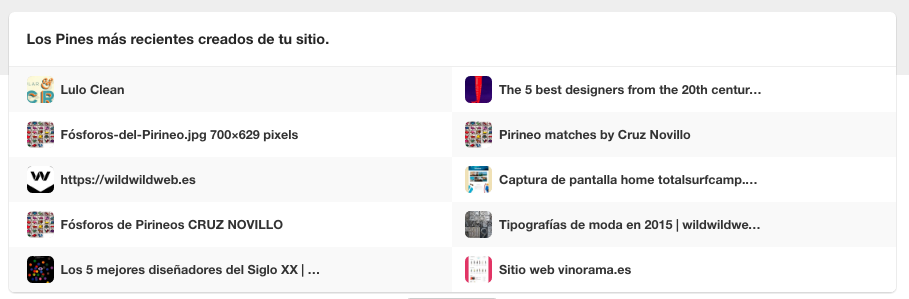
In this section you will find the most important information about the content you share.
You can choose the results according to the impressions, the repins, the clicks and the whole period.
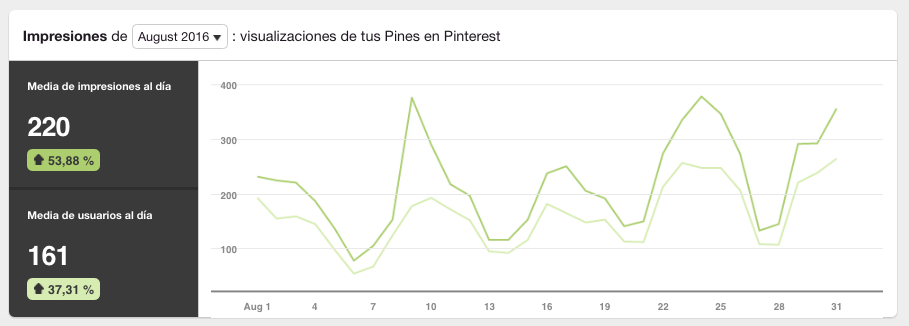
-The impressions are the number of times your pins have appeared at the beginning, the category of pins and in the search for Pinterest.
-The pins saved or repeated are the number of times someone saves your pin on their board, this is the best way to share your content.
-The clicks are the number of clicks on the pins of your profile. This is one of the values that we are most interested in measuring, since we obtain information about the users who have come to our website, i mean, they're the most interesting pins. Your audience wants to know more about these.
In the three previous sections we will find:
-The daily average of impressions/ saved/ clicks per day.
-The daily average of users / people who save / visits per day.
In addition to the above, we also find the following data:
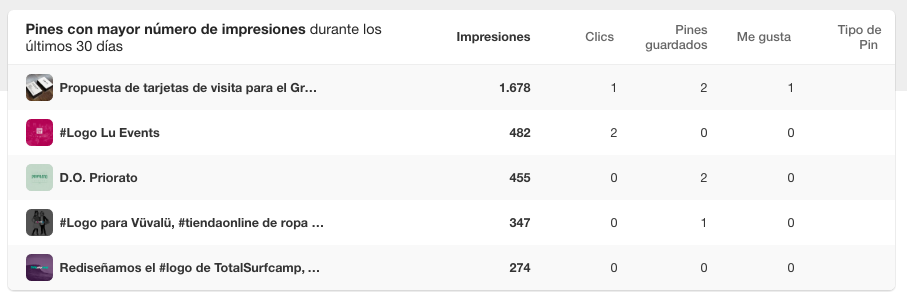
-Pins with the highest number of impressions/ most saved pins/ most clicks during the last 30 days.
-Dashboards of the pins with the highest number of prints/ with the most saved pins/ most clicks during the last 30 days.
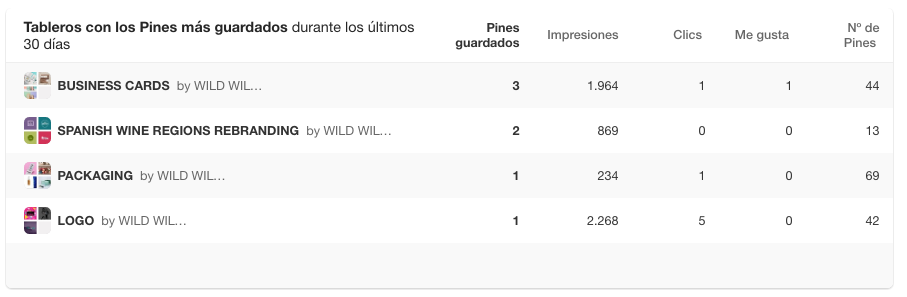
These will help us know which pins are working best, either to create new ones that follow that line or to see the trajectory of specific pins during a campaign..
Don't forget to arrange your boards in such a way that the pins you are interested in enhancing are visible when you access your profile.
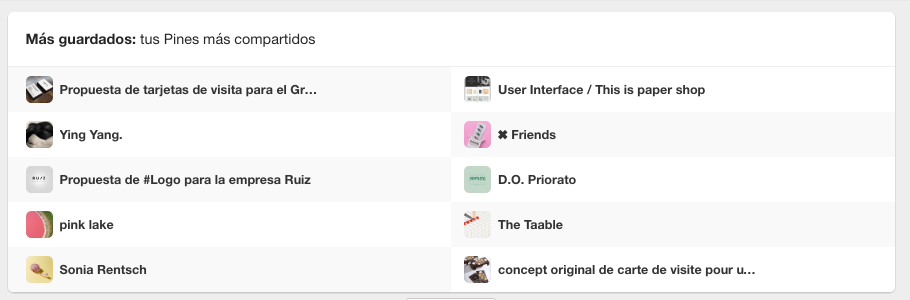
The "Whole period" section shows the analysis of your pins since you opened the account.
Here we find your most saved pins, most searched pins and super pins, which contain a combination of saved pins, clicks and more. Remember that you have to describe your pins well to increase the frequency in which they appear in the search.
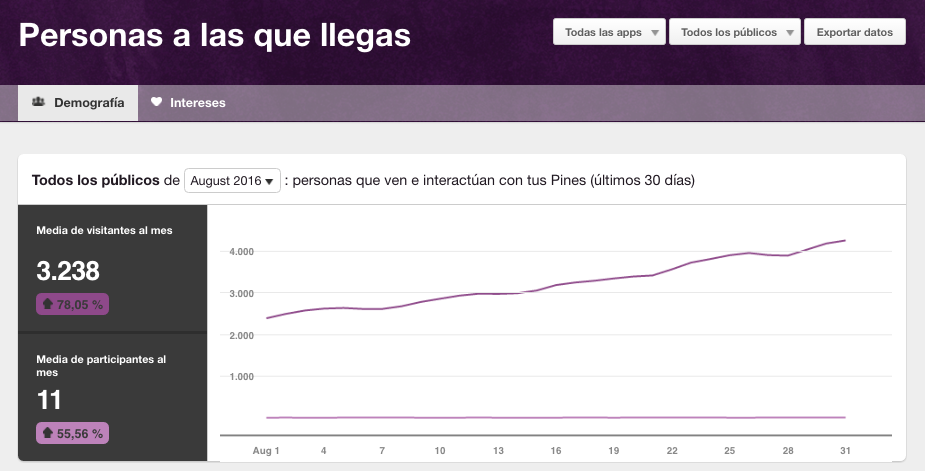
2. People you reach. What's our audience?
In this section we find all the metrics related to the audience. In other words, users who have seen your pins, follow your dashboards or have interacted with your content in some way.
One part focuses on demographic data where we can know:
-The average number of visitors per month, which is the average number of impressions of your pins per month.
-The average number of interactions per month is the average number of people who interact with your pins per month.
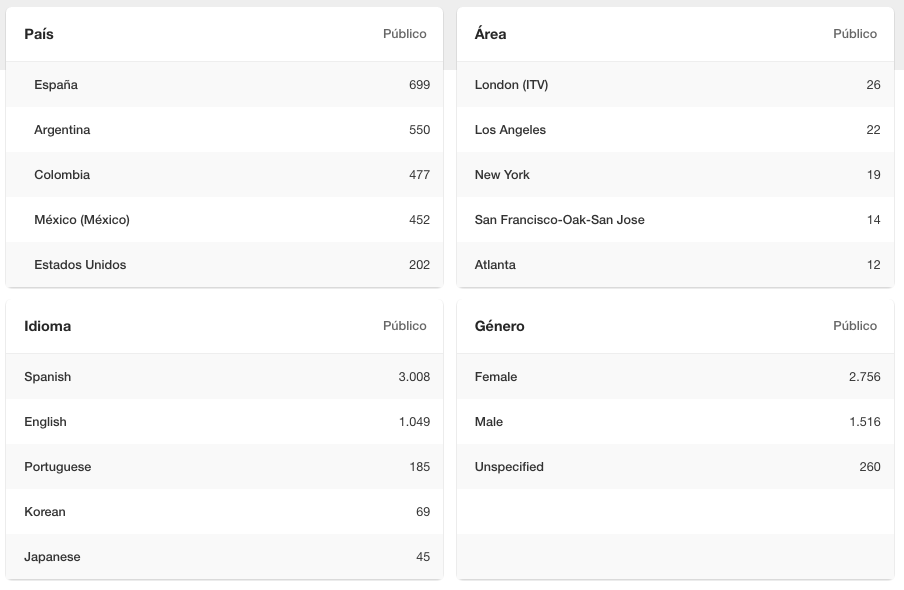
Another allows you to visualize data about the country, area, language and gender of your audience that will help you segment and customize the content for marketing strategies.
And the last part focuses on the interests of your audience, where you can get information about:
- the interests of followers, very useful for creating content that is attractive to our audience.
- the boards in which your audience includes your pins.
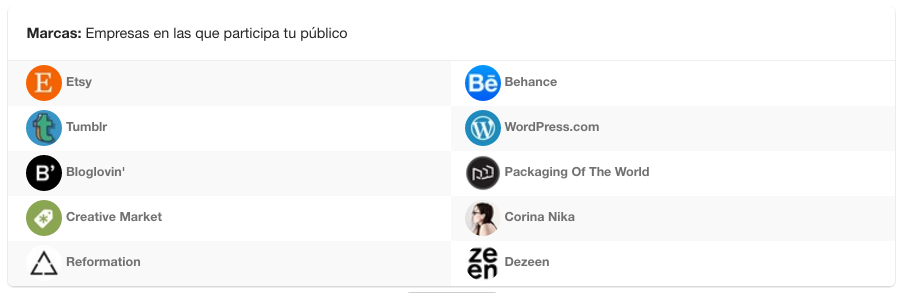
- brands, which are other company accounts that your audience follows in addition to yours and that will help you meet potential competitors.
Also in this section you can filter in all the public or just know the data of your followers.
3. Your website activity
As mentioned above, you will need to confirm your website in order to get these analytics.
In this chapter we find the same sections as in our profile: impressions, saved pins or repines, clicks and the whole period. These would be the same as in the first section but taking into account the pins linked to your website.
Two novelties that we found are:
-the original pins, are pins created from your site's save button, from browser extensions and manual pin uploads.
and the save button. Here Pinterest presents us with two graphs; the first shows the number of prints that were made with the save button, the number of times the save button was clicked, and the number of times a pin was created in Pinterest. And the second graph starts in Pinterest, it shows the impressions of the pins that were created from your website, the times they were saved, and the times those saved pins got clicks to your website.

These are very simple and clear analyses.
Use the metrics that suit you best to achieve your goals and remember to follow the wise personalized advice offered by Pinterest Analytics.
I hope this practical guide will help you use the tool and get the most out of it.
Main photo: Alex Wong
Related works

The digital transformation of one of the most prestigious and influential brands.
Designing the brand and the digital ecosystem of the leading website for coworking spaces in Spain.